Enrollment & Demographics

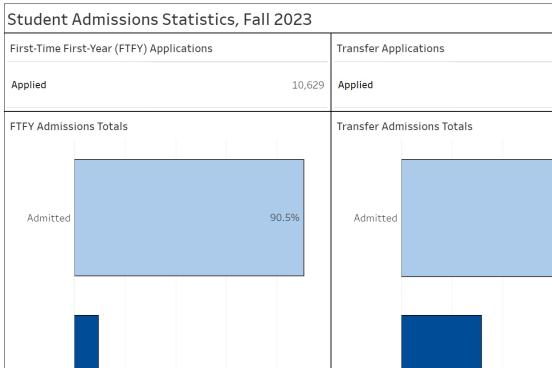
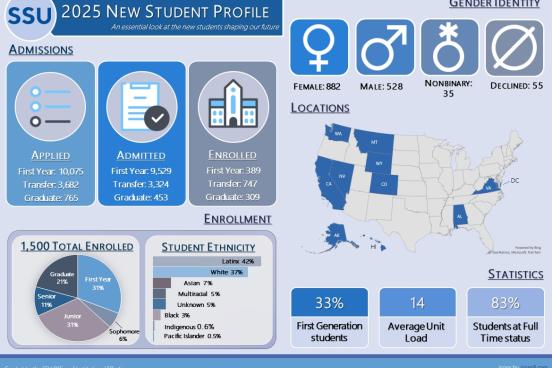
The Admissions dashboard displays key enrollment data. It shows the number of undergraduates who applied, were admitted and matriculated, as well as the percentage of in-state students.

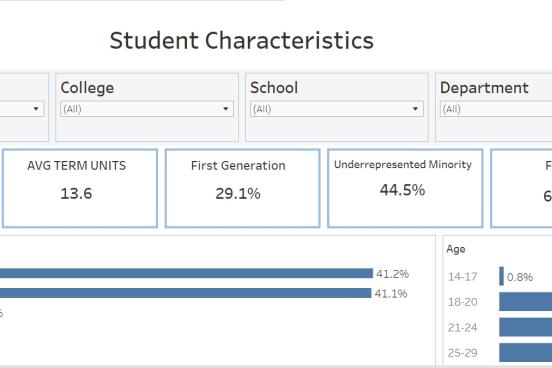
The Student Characteristics dashboard provides a snapshot of the student body. It displays headcount and breakdowns by demographics, enrollment patterns, and academic majors.

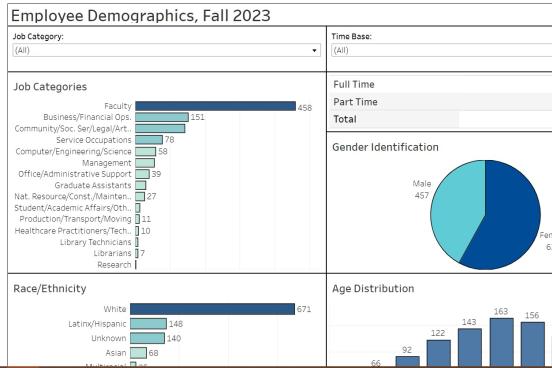
The Employee Demographics dashboard shows aggregated data on current SSU employees, including job category, race/ethnicity, time base and age, filtered by time base and job category.

Charts and diagrams representing Sonoma State University data.

