Tableau Navigation
Data Visualization Navigation Tips
The SSU Tableau site organizes content by project folders, then by workbooks. Within a workbook, use the tabs at the top to explore different views or dashboards within the same workbook.
Figure 1- Navigate through tabs within a workbook.
Interact with Content
Published Tableau content is designed to help you see and understand data. As you interact with the filters and options, enjoy the process. Don’t worry, you will not break the view!
Filtering, Sorting, and Viewing Details
Filtering
Most of our dashboards give viewers the ability to filter data by different fields, such as term, academic level, or school. To filter the data, use the dropdown boxes to select the desired criteria.
Figure 2 demonstrates how to select one or more values in a single filter.
Figure 2 - Example of Filtering by School.
Sorting
Sort tables alphabetically or numerically by hovering over a column header, and clicking the sort icon, which is located next to the column/row headers.
Figure 3 demonstrates how to sort columns and rows.
Figure 3 - Sorting rows and columns.
Viewing Details
As you move your cursor across a Tableau view, you might see pop-up windows that reveal details about each data point. These "tooltips" appear when you hover (rather than click) on a data point. Not all data visualizations include tooltips.
Figure 4 - Hover for Details.
The information icon

We use the information icon to provide important context and definitions about the data. Watch for the icon and hover to view the tooltip with these details.
Figure 5 - Hover for more information.
Standard Action Controls
Tableau includes a standard set of controls that can be found top left of the report, as pictured below. Their uses are as follows:
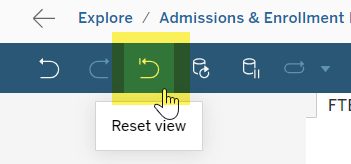
Figure 6 - Dashboard Interface highlighting the action functions.
- Undo and Redo: When filtering visualizations, the user can undo or redo an action by using these controls.
- Revert: If any changes have been made to the original state of the view/visualization (such as through changing the filter values), this will reset the view back to its original state.
- Refresh: Refreshes the current table or view by clearing any cache that may exist and retrieving the latest data from the data server.
- Pause: While interacting with the view, each change (such as selecting different filters) will often trigger a new query to be sent to the data server, and thus result in a wait time as the data in the view is updated. This control allows the ability to pause the data updates and to avoid waiting for each one as you make several changes at once. Clicking this button again will resume automatic data updates.